The report is used to view summary data on sales, profit from sales, or the total value of store products. The report includes four sections:
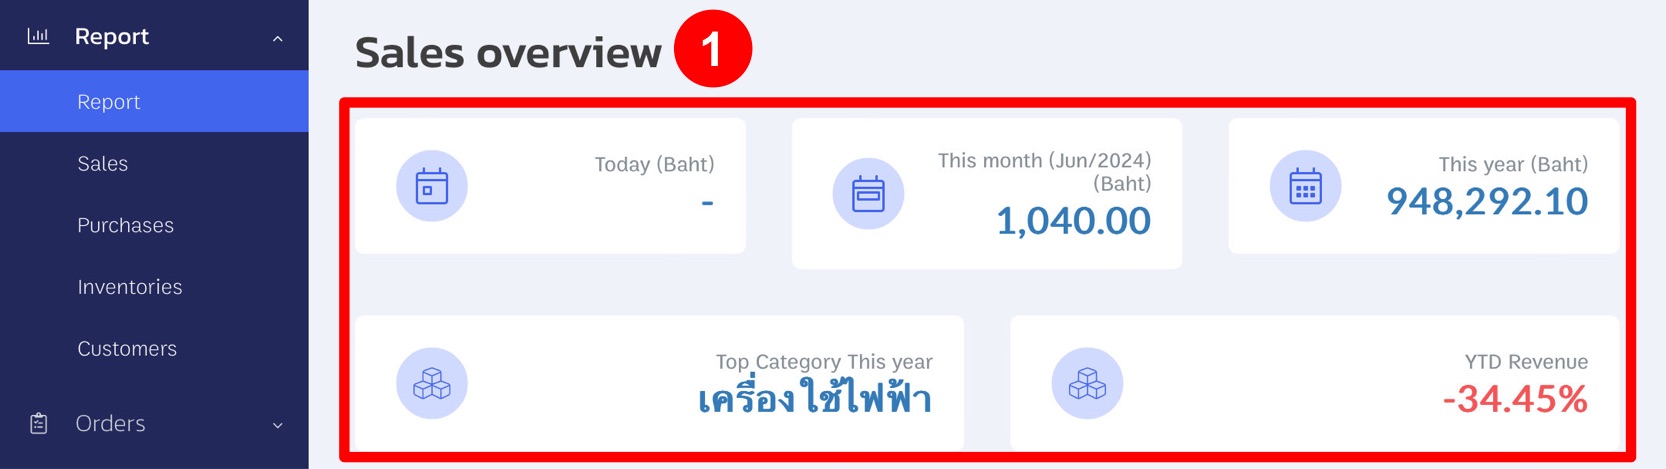
1. Sales Overview
This section includes total sales over specific periods (daily, monthly, yearly) and the top-selling categories for the year. It helps you track current sales performance and identify the best-selling categories.
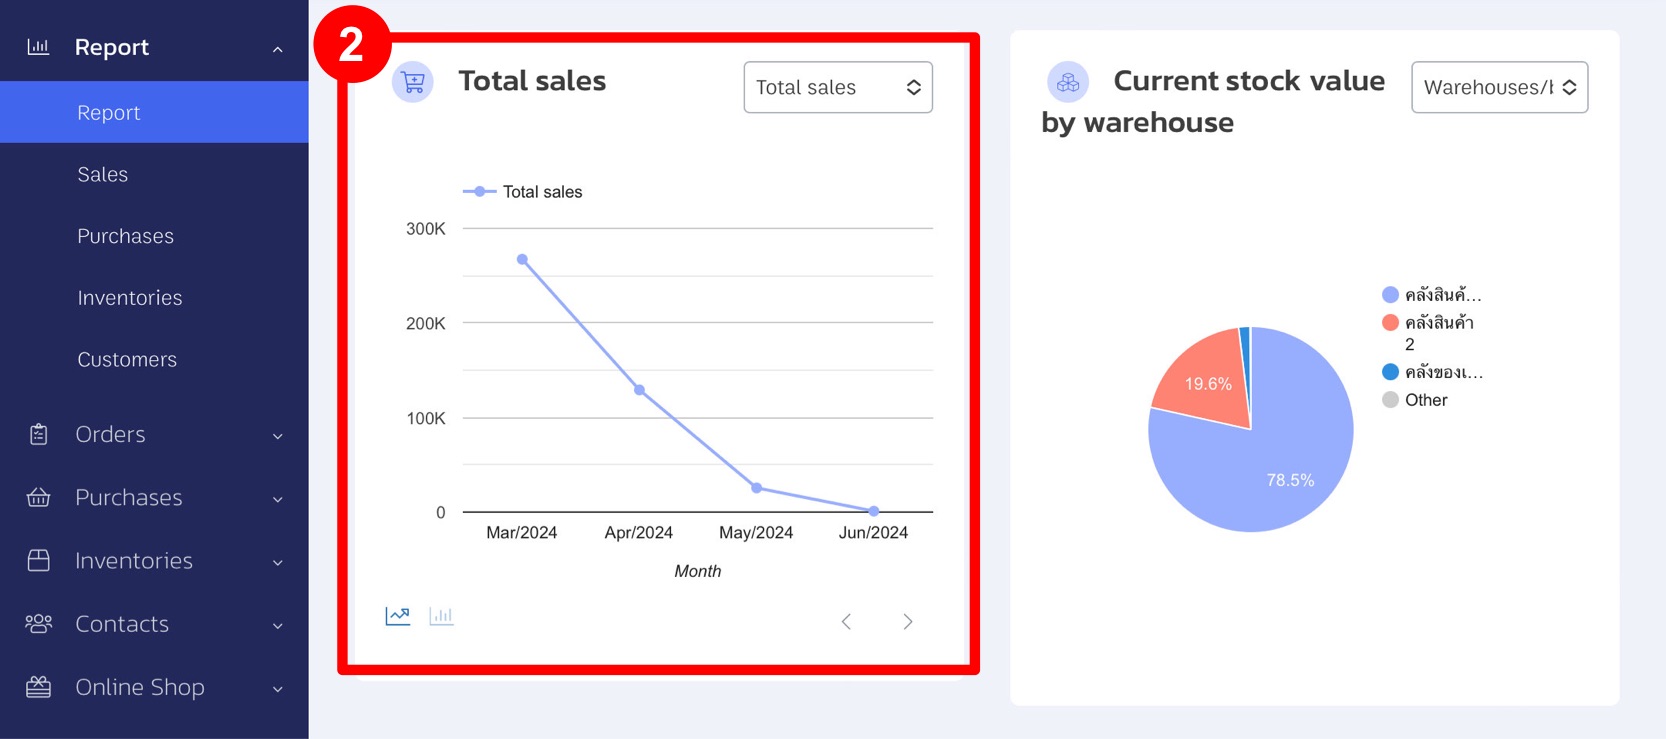
2. Sales and Profit Graphs
The graphs display total profit, profit from sales, sales, and sales by category. These are shown as line and bar charts, providing crucial insights for the business.
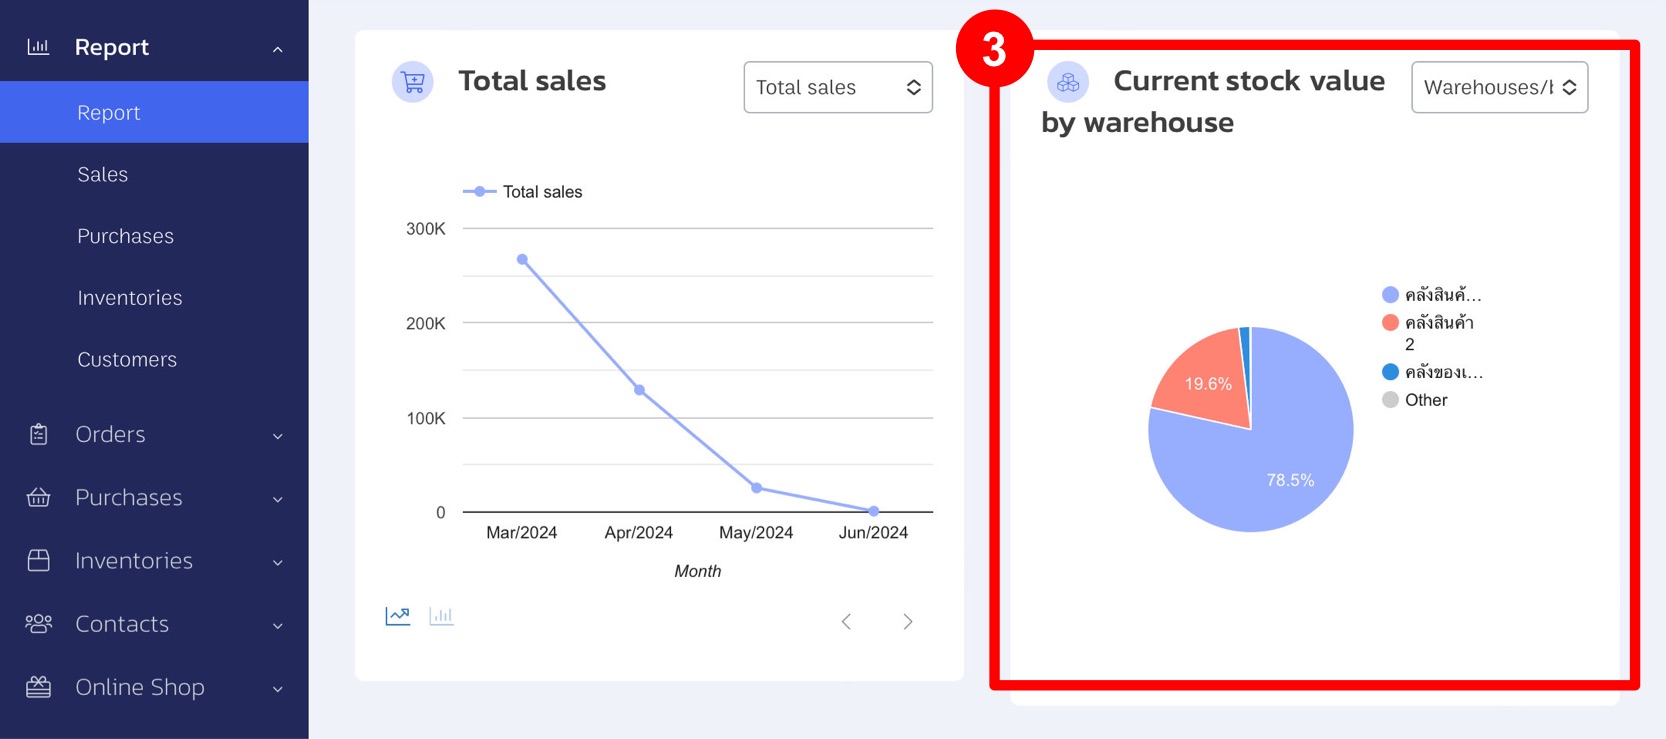
3. Current Stock Value by Warehouse
This section breaks down the value of inventory by warehouse and category, allowing you to see the current value of the remaining stock.
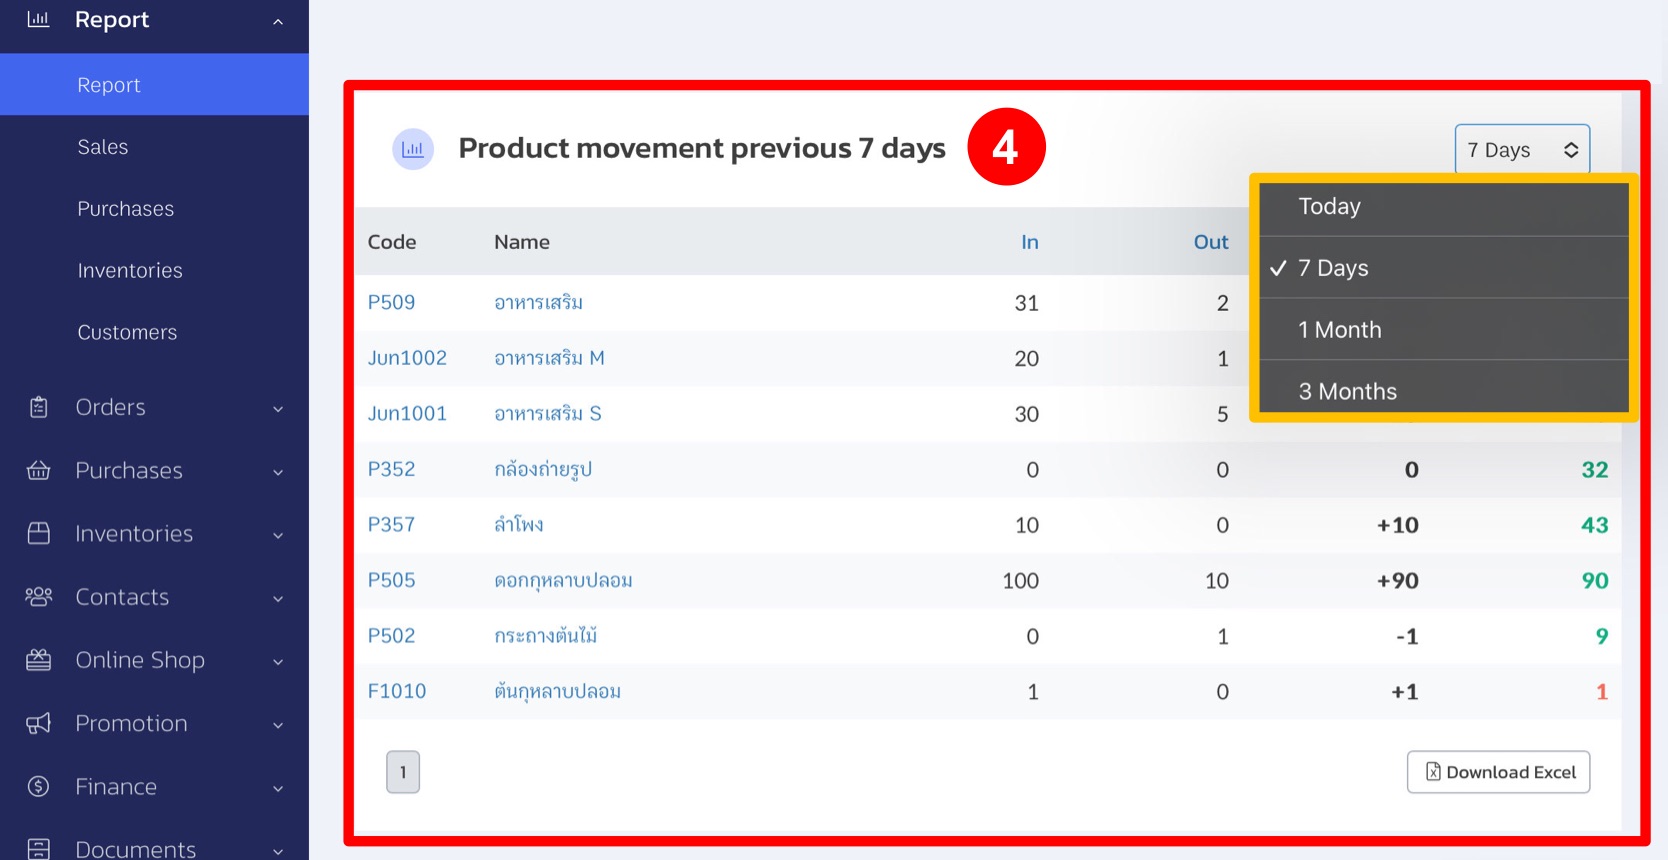
4. Product Movement
This section shows product movements over the past 7 days, 1 month, and 3 months. It helps analyze which products sold well or which were received but not sold, aiding in inventory management.
If you are interested in utilizing our comprehensive store management system,
we encourage you to reach out for further information.
Please do not hesitate to contact us at:
Phone: 02-026-6423
Email: support@zortout.com
LINE: @zort


